Understanding mixed-use zoning types in Singapore through Google Maps data
FCL researchers publish a method to define representative archetypes of mixed use developments in Singapore, to improve the accuracy of urban data analyses and simulations.
Many urban planning analyses require detailed information of the kinds of uses that exist on individual plots. For example, the distribution of shops, restaurants, offices and residences in a city influences the energy consumption and mobility patterns in a city, and is therefore of interest to planners wishing to optimise mobility or energy performance.
Yet it is not always obvious what types of uses exist in different parts of cities. Although most cities have master plans that specify the zoning type of each plot, this plan and its associated documents only describe at a general level what kinds of land uses are allowed on the plot. Particularly in the case of mixed-use zoning types, which allow many different kinds of uses, it is impossible to know the specific existing (rather than allowed) uses and their proportions based on the master plan.
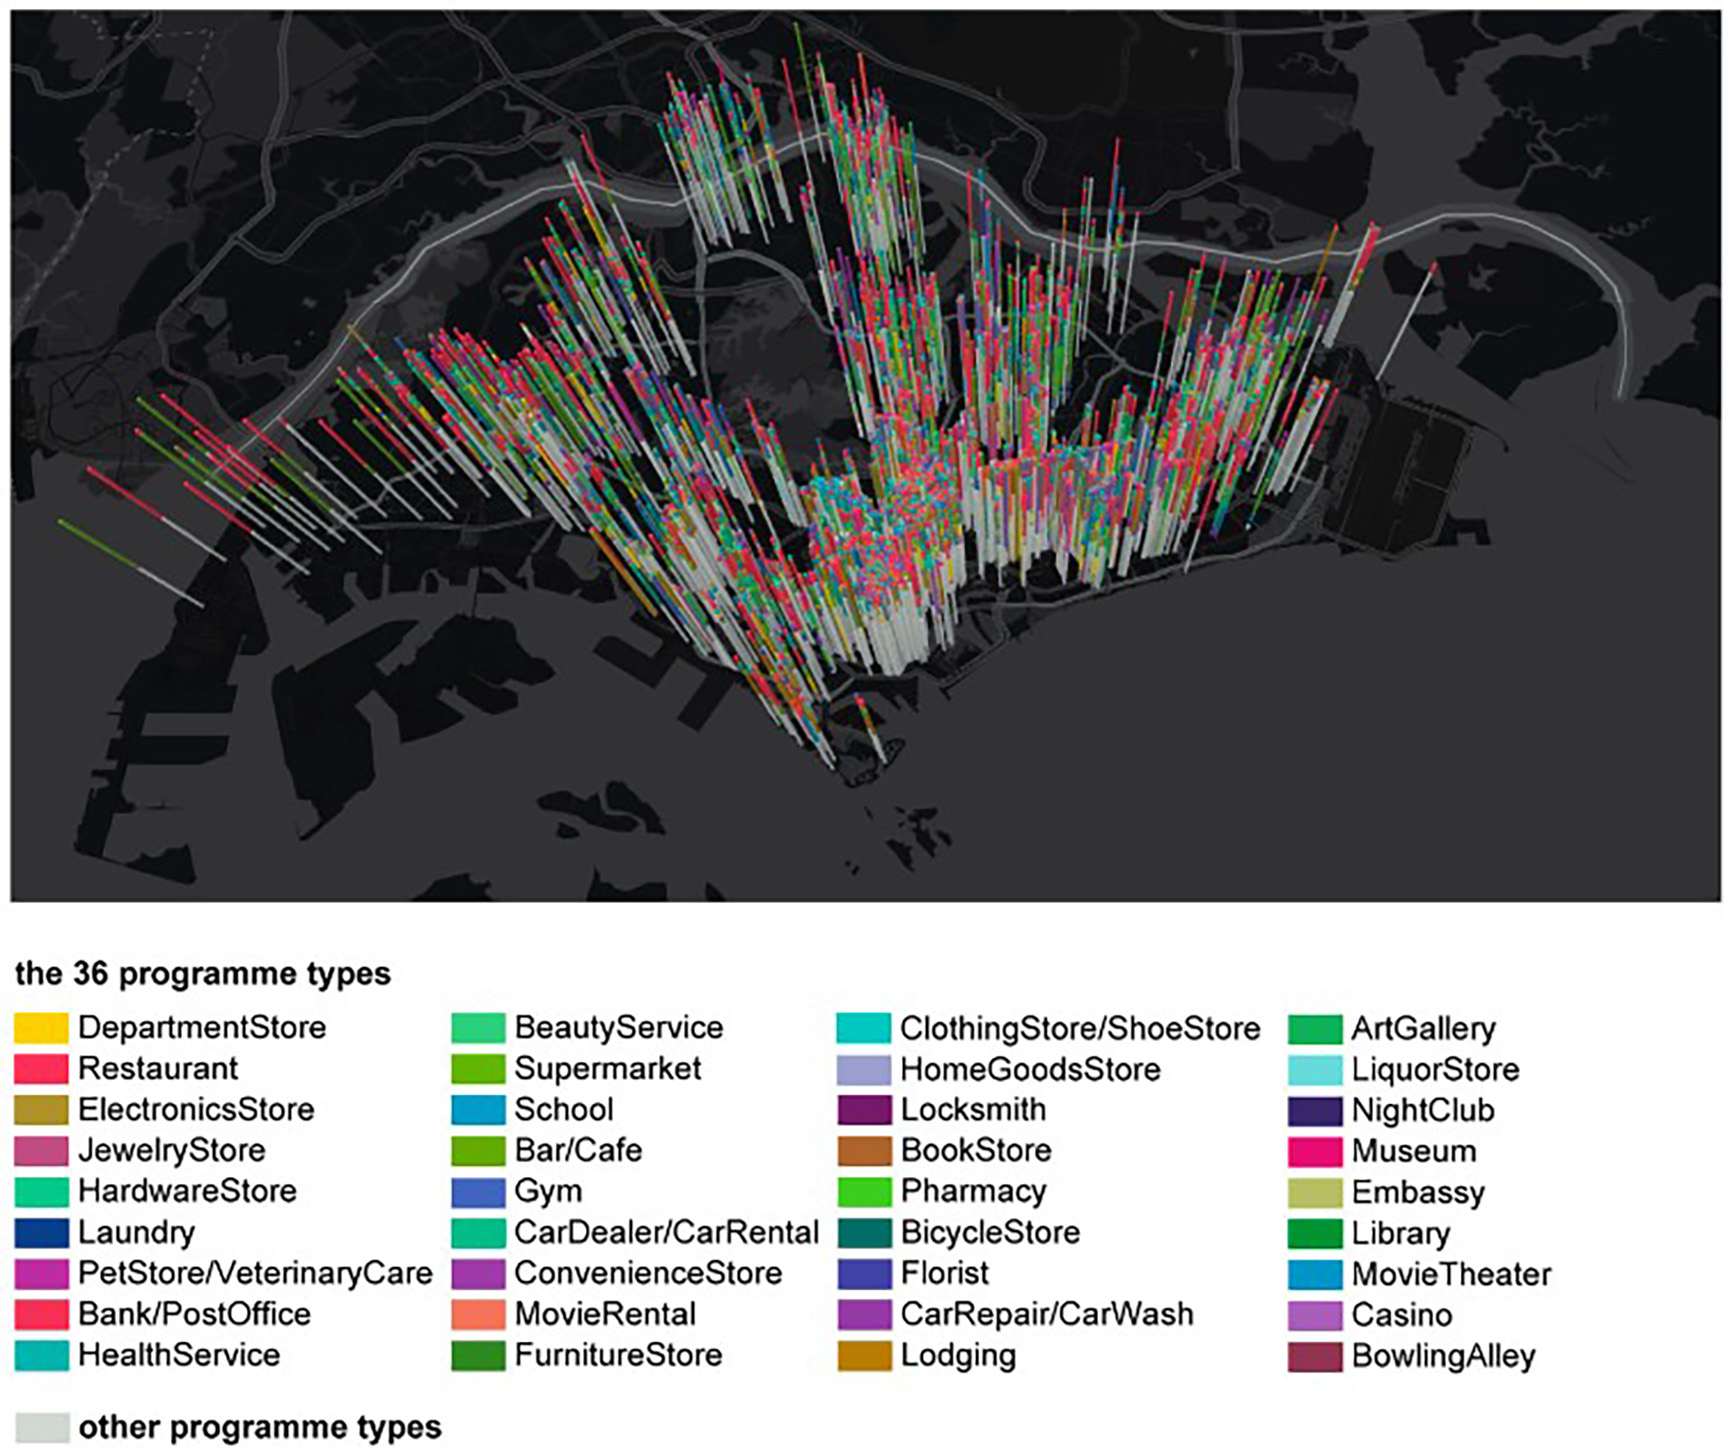
FCL Global researchers of the Cities Knowledge Graph project therefore external pagedeveloped a data-driven methodology to define mixed-use archetypes for cities, using Singapore as a case study. By combining the URA Singapore master plan data with Google Places data, it was possible to count the number of programmes (i.e. specific uses, such as restaurants, cinemas, bars, etc.) on 3064 mixed-use plots. Machine learning methods then allowed estimating the typical size of each programme, and the programmes’ share of the total gross floor area of each plot.
Clustering was then performed to group together plots that had similar proportions of different programmes. This clustering resulted in 163 mixed use ‘archetypes’, which can be matched to individual mixed use plots in Singapore based on the plot’s zoning type and gross plot ratio. Each archetype is a representative distribution of uses per surface area, to be multiplied by the gross floor area of the building(s) you are modelling.
These representative archetypes, in turn, can be used as input for urban analyses by city planners and analysts. To further this aim, the mixed-use archetype data were stored in the Cities Knowledge Graph, where they can be combined, for example, with mobility-related datasets, and used by urban energy analysis tools to enable new or improved urban analyses (as demonstrated in the paper).
external pageShi, Z., Silvennoinen, H., Chadzynski, A., von Richthofen, A., Kraft, M., Cairns, S., & Herthogs, P. (2022). Defining archetypes of mixed-use developments using Google Maps API data. Environment and Planning B: Urban Analytics and City Science, external pagehttps://doi.org/10.1177/23998083221141428